0DTE Options Open Interest as Futures Confirmation
Learn the 0DTE Open Interest Futures Confirmation 0DTE options strategy. Discover risk management and maximize your win rate today. Start trading smarter.
Trade with Confirmation
Stop guessing and start letting institutional data confirm your trades.
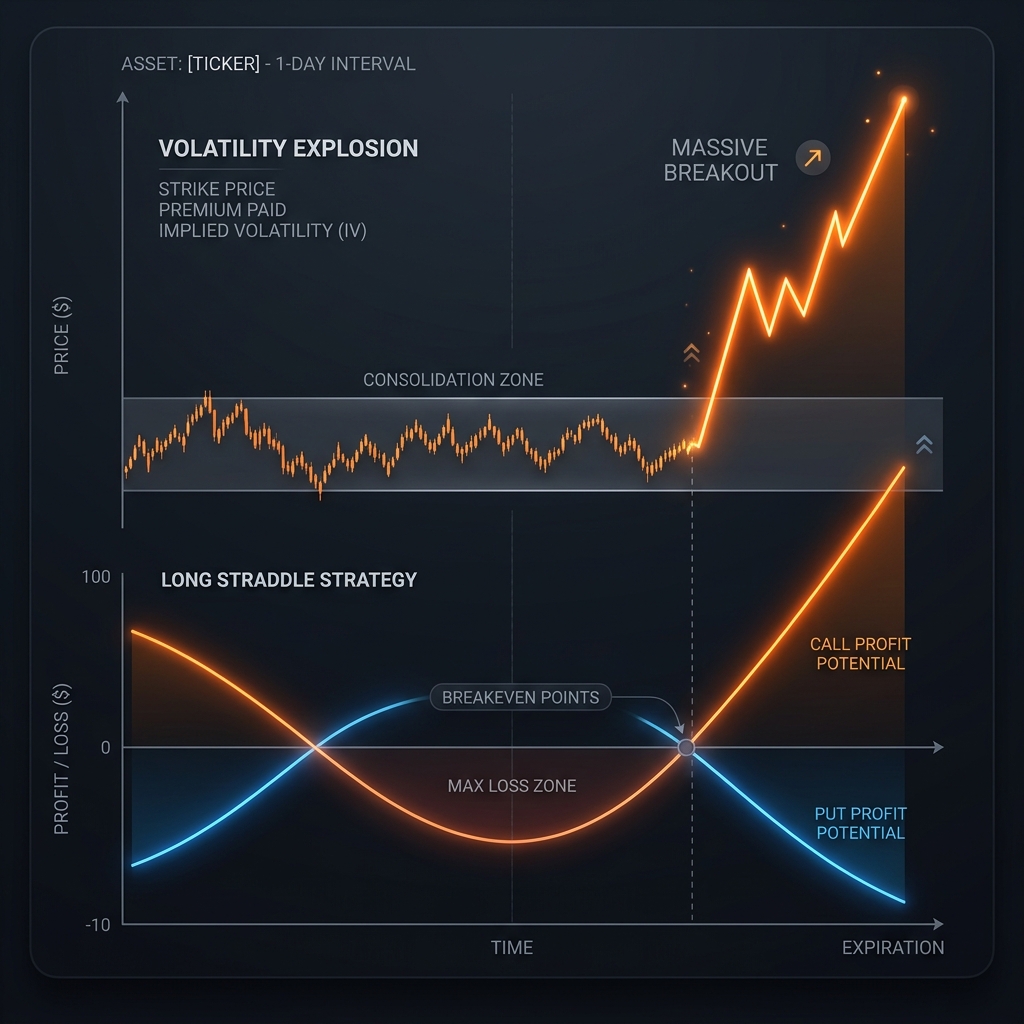
Whether you’re new to zero-days-to-expiration or scaling an existing approach, understanding the fundamentals of zero days to expiration trading is essential before you trade live capital. This guide covers.
The Anatomy of Open Interest (OI)
In the fast-paced world of intraday futures trading, “volume” is the metric most retail traders obsess over. They watch a massive green volume node on a 1-minute chart and assume a breakout is imminent. However, in the derivatives market, volume can be incredibly deceiving. It only tells you how many contracts changed hands; it doesn’t tell you if those traders were opening new positions or simply closing out old ones.
To see the true structural framework of the market, you must look at Open Interest (OI).
Open Interest represents the total number of outstanding, active contracts that have not yet been settled. In the context of 0DTE (Zero Days to Expiration) options on the SPX, the distribution of OI across different strike prices forms the invisible scaffolding of the E-mini S&P 500 (ES) futures market. It reveals exactly where institutions have parked their capital and where market makers have drawn their lines in the sand.
When a futures trader learns to cross-reference their technical chart with the 0DTE OI profile, they gain access to the ultimate trade confirmation tool.
Reading the OI Topography
The 0DTE OI profile is rarely perfectly balanced. It usually features massive clusters of contracts (often called “Walls”) at specific, whole-number strike prices (e.g., 5100, 5150, 5200). These walls act as intense gravitational fields for the ES futures.
The Call Wall (The Ceiling)
- The Structure: A massive concentration of Call option Open Interest sitting above the current futures price.
- The Mechanics: Retail and institutional speculators have bought a massive number of calls at this level. Consequently, market makers are heavily short calls at this level. If the ES rallies toward this strike, the market makers’ short calls begin to lose money rapidly. To protect themselves, market makers will aggressively short ES futures as the price approaches the Call Wall, creating intense, structural selling pressure.
- Futures Confirmation: If your technical chart shows a bullish breakout, but you see a massive 0DTE Call Wall sitting just 5 points higher, do not buy the breakout. The upside is structurally capped. However, if the ES approaches the Call Wall and stalls, it confirms a high-probability short (mean-reversion) setup.
The Put Wall (The Floor)
- The Structure: A massive concentration of Put option Open Interest sitting below the current futures price.
- The Mechanics: The inverse of the Call Wall. Market makers are net-short puts at this level. If the market drops toward the Put Wall, dealers must aggressively buy ES futures to hedge their Delta risk, creating a structural floor.
- Futures Confirmation: If the ES is selling off heavily and approaches the Put Wall, do not initiate new short positions. The algorithmic buying required to defend that level will likely trigger a violent bounce. This is the optimal zone to look for long scalp confirmations.
The OI Confirmation Checklist
Trading ES futures is an exercise in probability. Every indicator you layer on top of a trade setup should increase the probability of success. Here is the exact checklist professional traders use to confirm a futures setup using 0DTE OI data.
1. The Technical Confluence Check
OI walls are powerful, but they are not impenetrable. They work best when they align perfectly with traditional Technical Analysis (TA).
- Does the 5150 Call Wall perfectly align with yesterday’s Value Area High (VAH)?
- Does the 5100 Put Wall align with the pre-market low? If you have TA confluence with an OI Wall, your trade conviction should be at maximum.
2. The Volume Confirmation Check
While OI represents the static structure of the market, options volume represents the active, intraday flow.
- If the ES is rallying toward a Call Wall, check the live options volume.
- Are traders actively buying more calls at that strike (adding to the wall), or are they rolling their calls to a higher strike (removing the resistance)? If volume confirms the OI is holding, you can confidently fade the rally.
3. The Intraday OI Shift Check
0DTE Open Interest is unique because it changes dynamically throughout the day. While traditional options only update OI overnight, 0DTE data platforms track intraday estimates of OI shifts.
- If you are short the ES, and you notice the massive Put Wall below you is suddenly evaporating (traders are closing their puts), the structural floor has been removed. This confirms your short thesis, and you can hold the trade for a deeper breakdown.
Trading the OI “Squeeze”
What happens when an OI Wall fails? It creates the most explosive futures setup of the day: The Gamma Squeeze.
If a massive macroeconomic catalyst hits the tape (e.g., a surprise CPI print), directional volume can overpower the market makers’ hedging capacity. If the ES aggressively breaches a massive Call Wall, all of the market makers who were short those calls are now instantly trapped underwater.
To survive, they must abandon their short futures hedges and frantically buy ES futures at market price to cover their exposure. This creates a reflexive, self-feeding buying frenzy.
The Setup: If you see the ES grind through a verified Call Wall, and the options tape shows traders aggressively buying even higher strike calls, the resistance has failed. The futures trader must immediately flip long. The resulting squeeze will often rip 15 to 25 points in a matter of minutes with zero pullbacks.
Limitations and Caveats
- The Basis Gap: ES futures do not trade at the exact same price as the SPX index (which the 0DTE options are based on). There is a slight premium or discount known as the “basis.” When mapping SPX OI walls to your futures chart, you must adjust the strike price by the current basis spread.
- Complex Spreads: High OI at a specific strike might just be one leg of a massive institutional Iron Condor or Butterfly spread. It may not represent pure directional resistance. Always look at the entire OI profile, not just a single strike.
- The Zero Gamma Line: If the market crosses the Zero Gamma line, the hedging behavior of market makers flips from suppressing volatility to accelerating it. OI walls become less reliable in a negative gamma environment.
Conclusion: Structural Confidence
Trading futures blindly is gambling. Relying solely on technical indicators is trading in the past. But when you overlay your futures chart with the live, structural Open Interest topography of the 0DTE options market, you are trading with true institutional confidence. You know exactly where the market makers have built their fortresses, and you know exactly what they must do to defend them. You stop guessing where the market might turn, and you start waiting for the market to hit the mathematical walls where it must turn.
The Institutional Edge: Decoding Market Maker Positioning
Retail traders often focus exclusively on price charts, technical indicators, and moving averages. However, in the realm of 0DTE options, price action is merely a symptom of a much larger underlying structure: Dealer Positioning.
Institutional options dealers (market makers) are obligated to take the other side of your trades. When you buy a call, they are short that call. To remain delta-neutral and protect their massive portfolios, these dealers must constantly buy and sell the underlying futures (ES or NQ) to hedge their options exposure.
Understanding Gamma Squeezes
When market makers are caught with “negative gamma” (meaning they are short options that are rapidly moving into the money), they are forced to buy the underlying futures as the market rises, or sell as it falls. This forced buying/selling accelerates the trend, creating a Gamma Squeeze.
Negative Gamma Regimes
In these environments, dealer hedging accelerates market moves. Volatility expands, intraday swings become violent, and momentum strategies (like buying breakouts) thrive.
Positive Gamma Regimes
In these environments, dealers trade against the trend (buying dips, selling rips) to stay neutral. Volatility compresses, the market chops sideways, and mean-reversion strategies thrive.
Advanced Risk Management for Index Futures
Trading 0DTE options on index futures is inherently leveraged. Without a strict, mathematically defined risk management framework, an account can be liquidated in a single afternoon.
The 1% Rule
The foundational rule of professional intraday trading is the 1% rule. Never risk more than 1% of your total account equity on a single 0DTE trade setup. If you have a $10,000 account, your maximum acceptable loss per trade is $100.
Defining Risk in 0DTE
If you are buying premium (long calls/puts), your risk is naturally defined by the premium paid. However, if you are selling premium (credit spreads), your risk is the width of the spread minus the credit received. Always calculate your absolute max loss before clicking the buy button.
Sequential Stop Losses
Professionals do not use static stop losses on 0DTE options because the premium fluctuates too wildly due to Gamma and Vega expansion. Instead, they use structural stops based on the underlying futures price. If ES breaks a critical support level, the option is immediately liquidated, regardless of its current P&L percentage.
The Psychology of Intraday Leverage
The primary reason traders fail in the 0DTE futures space is not a lack of technical knowledge; it is a breakdown in psychological discipline.
The Dopamine Trap
0DTE options provide immediate feedback. Within 15 minutes, you can be up 50% or down 50%. This creates a dopamine feedback loop identical to casino gambling. When a trader hits a massive 300% winner, their brain rewires itself to seek that exact high again, leading to over-leveraging and abandoning proven strategies.
Revenge Trading
After a sharp loss, the instinct is to immediately double the position size on the next trade to “make it back.” This is the fastest way to blow an account.
Fear of Missing Out (FOMO)
Watching the market trend 50 points without you causes immense psychological pain. Entering a trade late simply because it is moving usually results in buying the exact top.
Comprehensive FAQ: 0DTE Futures Trading
Why trade 0DTE on Futures instead of SPY?
Futures options (like ES and NQ) enjoy Section 1256 tax treatment (60% long-term / 40% short-term capital gains) in the US, providing massive tax advantages over SPY. Additionally, futures offer deep overnight liquidity and avoid Pattern Day Trader (PDT) rule restrictions.
What is the best time of day to trade 0DTE?
The highest probability setups occur between 9:45 AM (after initial volatility settles) and 11:30 AM EST, and again during the “Power Hour” from 3:00 PM to 4:00 PM EST. The midday session is typically choppy and dangerous due to heavy theta decay.
How much capital is required?
While some brokerages allow micro-futures trading with just $500, a professional account should have a minimum of $5,000 to safely absorb intraday drawdowns and size positions correctly (using the 1% rule).
Do I need Level 2 data?
While traditional Level 2 (order book) data is helpful, institutional derivatives data (GEX, Max Pain, options order flow) is significantly more important for 0DTE trading, as options market makers dictate intraday index pinning.
To further refine your strategy, consider comparing this approach with the 0DTE Gamma Exposure (GEX) and ES Futures or exploring the mechanics behind SPX 0DTE vs ES Futures: The Liquidity Showdown. Everything ties back into the foundational concepts available in our 0DTE for Futures Hub.
To see these concepts applied in real-time, the 01DTE dashboard provides the exact GEX and heatmap data needed.
Ready to Master Options Open Interest as Futures Confirmation?
Stop guessing and start executing with precision. Join our community of professional traders and get access to real-time gamma levels, flow analysis, and institutional-grade trading tools.
Start Trading NowFrequently Asked Questions
What is 0DTE Open Interest Futures Confirmation in the context of 0DTE trading?
Yes, understanding 0DTE Open Interest Futures Confirmation is critical for day traders. It refers to the specific methodology of managing zero days to expiration positions by leveraging intraday volatility. Traders use this approach to capture rapid premium decay while strictly defining their risk parameters. By utilizing this strategy correctly, you can optimize your entry and exit points throughout the trading session without holding overnight risk.
How does 0DTE Open Interest Futures Confirmation impact risk management?
The primary risk when using 0DTE Open Interest Futures Confirmation involves sudden intraday market reversals (gamma risk). Because 0DTE options expire the same day, any adverse movement in the underlying asset can result in rapid, exponential losses if left unmanaged. Strict stop losses, position sizing limits (risking no more than 1% to 2% of account capital), and automated risk controls are absolutely essential to survive over the long term.
Is 0DTE Open Interest Futures Confirmation suitable for beginner traders?
No, beginners should exercise extreme caution. 0DTE Open Interest Futures Confirmation requires a deep understanding of options pricing models, Greek dynamics (especially Gamma and Theta), and order execution speed. Novice traders should spend several months paper trading and backtesting their approach before risking live capital, as the emotional and financial swings associated with this strategy can be overwhelming without prior experience.
What is the best time of day to execute 0DTE Open Interest Futures Confirmation?
Execution timing depends heavily on the specific setup, but many professional traders prefer to enter 0DTE Open Interest Futures Confirmation trades during the mid-morning session (around 10:30 AM to 11:30 AM EST) after the initial opening volatility has subsided. Others wait for the final two hours of the day (2:00 PM to 4:00 PM EST) to capture the most aggressive phase of theta decay, though this carries elevated directional risk.
Which brokers are best for trading 0DTE Open Interest Futures Confirmation?
For executing 0DTE Open Interest Futures Confirmation, you need a broker with direct market access, lightning-fast execution, and favorable commission structures. Interactive Brokers, Tastytrade, and ThinkOrSwim (Charles Schwab) are highly recommended by professionals. These platforms offer robust API integrations, advanced charting tools, and the necessary options permissions (Level 2 or higher) required to trade complex intraday strategies effectively.
Disclaimer: This content is for educational purposes only. Not financial advice. Options trading involves substantial risk. Consult a licensed financial advisor before trading. Full disclaimer
Related Articles
0DTE Max Pain Futures Targets | 0DTE Trading Strategy Guide
Master the 0DTE Max Pain Futures Targets 0DTE trading strategy. Learn risk management, setups, and maximize your win rate today with our comprehensive guide.
0DTE Leading Indicator ES | 0DTE Options Trading Strategy
How 0DTE options activity leads ES futures price action. Master the art of using real-time institutional options flow to predict explosive futures moves.
0DTE Options Data ES Trading | 0DTE Options Trading Strategy
Master the 0DTE Options Data ES Trading 0DTE trading strategy. Learn risk management, setups, and maximize your win rate today with our comprehensive guide.
0DTE Butterfly Spread Options Trading Strategy | 0DTE Guide
Master the 0DTE Butterfly Spread 0DTE trading strategy. Learn risk management, setups, and maximize your win rate today with our comprehensive guide.
0DTE Dashboard Tools Compared | 0DTE Trading Strategy Guide
Master the 0DTE Dashboard Tools Compared 0DTE trading strategy. Learn risk management, setups, and maximize your win rate today with our comprehensive guide.